工作室
🌐 Studio
Studio 提供了一个用于构建和测试你的代理的交互式用户界面,以及一个 REST API,将你的 Mastra 应用作为本地服务暴露出来。这让你可以在不必立即担心集成的情况下开始构建。
🌐 Studio provides an interactive UI for building and testing your agents, along with a REST API that exposes your Mastra application as a local service. This lets you start building without worrying about integration right away.
随着你的项目发展,Studio 的开发环境可以帮助你快速迭代你的代理。同时,Observability 和 Scorer 功能可以让你在每个阶段都能看到性能情况。
🌐 As your project evolves, Studio's development environment helps you iterate on your agent quickly. Meanwhile, Observability and Scorer features give you visibility into performance at every stage.
要开始,请按照以下说明在本地运行 Studio,或在 Mastra Cloud 中创建一个项目与团队协作。
🌐 To get started, run Studio locally using the instructions below, or create a project in Mastra Cloud to collaborate with your team.
启动工作室Direct link to 启动工作室
🌐 Start Studio
如果你使用 create mastra 创建了应用,请使用 dev 脚本启动本地开发服务器。你也可以直接用 mastra dev 来运行它。
🌐 If you created your application with create mastra, start the local development server using the dev script. You can also run it directly with mastra dev.
- npm
- pnpm
- Yarn
- Bun
npm run dev
pnpm run dev
yarn dev
bun run dev
一旦服务器启动,你可以:
🌐 Once the server's running, you can:
- 在 http://localhost:4111/ 打开 Studio 用户界面以互动方式测试你的代理。
- 访问 http://localhost:4111/swagger-ui 以发现并与底层 REST API 进行交互。
工作室界面Direct link to 工作室界面
🌐 Studio UI
Studio UI 提供了一个交互式开发环境,让你可以测试你的代理、工作流和工具,准确观察每次交互背后的具体过程,并在过程中进行调整。
🌐 The Studio UI provides an interactive development environment for you to test your agents, workflows, and tools, observe exactly what happens under the hood with each interaction, and tweak things as you go.
代理Direct link to 代理
🌐 Agents
直接与你的代理聊天,动态切换模型,并调整如温度和top-p等设置,以了解它们如何影响输出。
🌐 Chat with your agent directly, dynamically switch models, and tweak settings like temperature and top-p to understand how they affect the output.
当你与你的代理互动时,你可以跟踪其每一步的推断,查看工具调用的输出,并观察跟踪和日志以了解响应是如何生成的。你还可以附加评分器来衡量和比较响应质量随时间的变化。
🌐 When you interact with your agent, you can follow each step of its reasoning, view tool call outputs, and observe traces and logs to see how responses are generated. You can also attach scorers to measure and compare response quality over time.
工作流程Direct link to 工作流程
🌐 Workflows
将你的工作流程可视化为图表,并使用自定义输入逐步运行。在执行过程中,界面会实时更新,以显示当前步骤和执行路径。
🌐 Visualize your workflow as a graph and run it step by step with a custom input. During execution, the interface updates in real time to show the active step and the path taken.
在运行工作流程时,你还可以查看显示工具调用、原始 JSON 输出以及可能发生的任何错误的详细追踪信息。
🌐 When running a workflow, you can also view detailed traces showing tool calls, raw JSON outputs, and any errors that might have occurred along the way.
工具Direct link to 工具
🌐 Tools
在独立环境中运行工具以观察其行为。在将它们分配给你的代理之前先测试它们,或者在出现问题时将它们隔离以进行调试。
🌐 Run tools in isolation to observe their behavior. Test them before assigning them to your agent, or isolate them to debug issues should something go wrong.
MCPDirect link to MCP
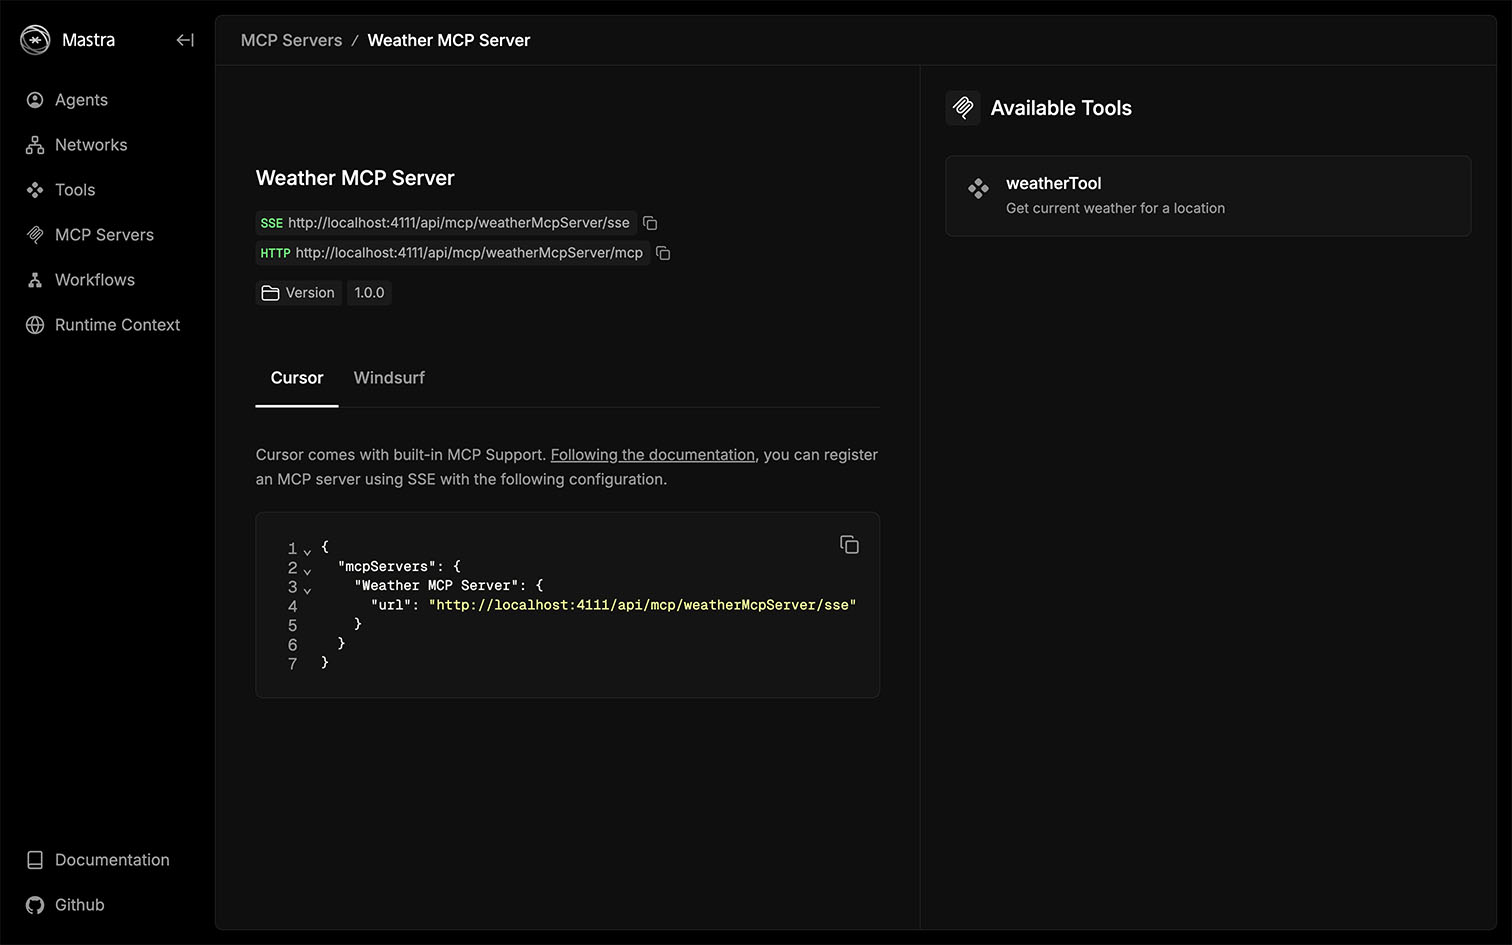
列出附加到你的 Mastra 实例的 MCP 服务器,并探索它们可用的工具。
🌐 List the MCP servers attached to your Mastra instance and explore their available tools.
可观测性Direct link to 可观测性
🌐 Observability
当你运行代理或工作流时,“可观测性”标签会显示突出关键 AI 操作的追踪,例如模型调用、工具执行和工作流步骤。跟随这些追踪,你可以看到数据的流动、时间的分配以及后台的运作情况。
🌐 When you run an agent or workflow, the Observability tab displays traces that highlight the key AI operations such as model calls, tool executions, and workflow steps. Follow these traces to see how data moves, where time is spent, and what's happening under the hood.

追踪会过滤掉低级框架细节,让你的追踪保持专注且易读。
🌐 Tracing filters out low-level framework details so your traces stay focused and readable.
得分手Direct link to 得分手
🌐 Scorers
“得分者”选项卡显示你的代理得分器运行时的结果。当消息通过你的代理时,已定义的得分器会异步评估每个输出,并在此处呈现其结果。这使你能够了解得分器如何对不同交互做出反应,比较各个测试案例的表现,并识别需要改进的地方。
🌐 The Scorers tab displays the results of your agent's scorers as they run. When messages pass through your agent, the defined scorers evaluate each output asynchronously and render their results here. This allows you to understand how your scorers respond to different interactions, compare performance across test cases, and identify areas for improvement.
REST APIDirect link to REST API
本地开发服务器提供完整的 REST API 路由集,允许你在开发过程中以编程方式与你的代理、工作流和工具进行交互。如果你计划部署 Mastra 服务器,这一点尤其有用,因为本地开发服务器使用与 Mastra 服务器 完全相同的 API 路由,让你能够在完全一致的环境下开发和测试。
🌐 The local development server exposes a complete set of REST API routes, allowing you to programmatically interact with your agents, workflows, and tools during development. This is particularly helpful if you plan to deploy the Mastra server, since the local development server uses the exact same API routes as the Mastra Server, allowing you to develop and test against it with full parity.
你可以在 http://localhost:4111/openapi.json 中探索 OpenAPI 规范中所有可用的端点,其中详细列出了每个端点及其请求和响应的模式。
🌐 You can explore all available endpoints in the OpenAPI specification at http://localhost:4111/openapi.json, which details every endpoint and its request and response schemas.
要交互式地探索 API,请访问 http://localhost:4111/swagger-ui 上的 Swagger UI。在这里,你可以发现端点并直接从浏览器进行测试。
🌐 To explore the API interactively, visit the Swagger UI at http://localhost:4111/swagger-ui. Here, you can discover endpoints and test them directly from your browser.
在生产环境中,OpenAPI 和 Swagger 端点默认是禁用的。要启用它们,请分别将 server.build.openAPIDocs 和 server.build.swaggerUI 设置为 true。
配置Direct link to 配置
🌐 Configuration
默认情况下,Studio 运行在 http://localhost:4111 。你可以在 Mastra 服务器配置中更改 host、port 和 studioBase。这允许你自定义 Studio 的托管位置和方式。
🌐 By default, Studio runs at http://localhost:4111. You can change the host, port, and studioBase in the Mastra server configuration. This allows you to customize where and how Studio is hosted.
此外,Mastra 通过 --https 标志支持本地 HTTPS 开发,该标志会自动为你的项目创建和管理证书。当你运行 mastra dev --https 时,会为 localhost(或你配置的主机)生成私钥和证书。访问 HTTPS 参考 了解更多信息。
🌐 Furthermore, Mastra supports local HTTPS development through the --https flag, which automatically creates and manages certificates for your project. When you run mastra dev --https, a private key and certificate are generated for localhost (or your configured host). Visit the HTTPS reference to learn more.
下一步Direct link to 下一步
🌐 Next steps