可观测性
🌐 Observability
Cloud 为生产应用提供可观察性,让你了解代理和工作流的行为。无论你的应用是部署在 Mastra Cloud、本地运行,还是托管在你自己的基础设施上,可观察性都能正常工作。任何 Mastra 项目都可以将追踪和日志发送到平台,无论其运行位置如何。
🌐 Cloud provides observability for production applications, giving you insight into how your agents and workflows behave. Observability works whether your application is deployed to Mastra Cloud, running locally, or hosted on your own infrastructure. Any Mastra project can send traces and logs to the platform regardless of where it's running.
有关配置可观测性的详细信息,请参阅 Cloud Exporter 文档。
🌐 For details on configuring observability, see the Cloud Exporter docs.
痕迹Direct link to 痕迹
🌐 Traces
通过使用其中一个支持的提供商启用可观察性,可以获得代理和工作流的跟踪信息。
🌐 Traces are available for both agents and workflows by enabling observability using one of the supported providers.
代理Direct link to 代理
🌐 Agents
启用可观测性后,你可以在 Studio 的 Traces 部分查看代理的详细输出。
🌐 With observability enabled, you can view detailed outputs from your agents in the Traces section in Studio.
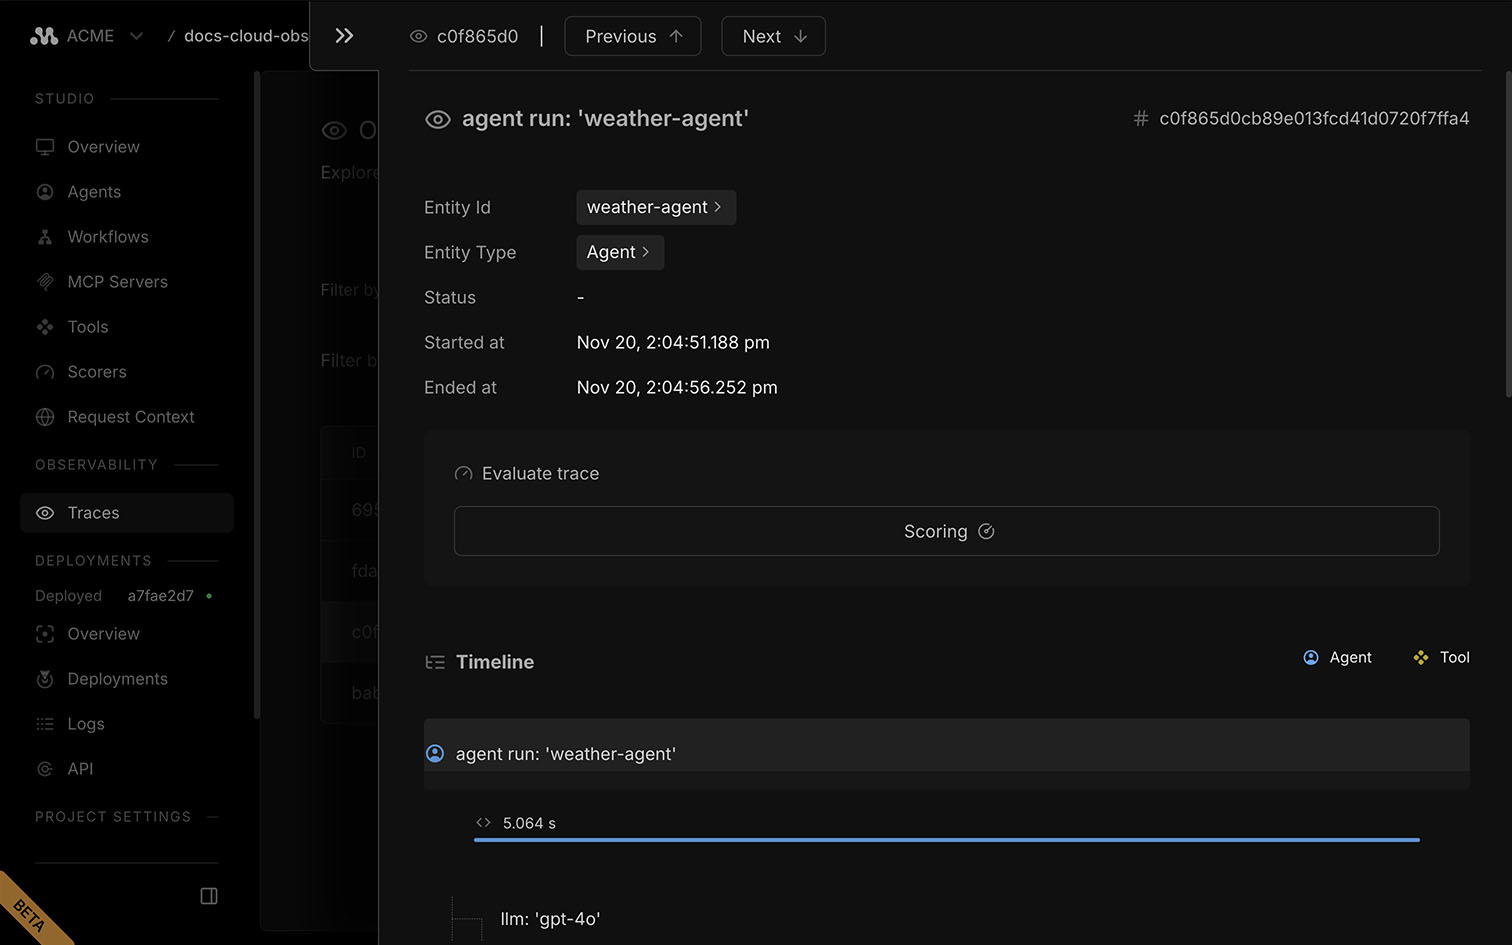
代理追踪将一次运行分解为明确的步骤:模型调用、工具调用和中间片段。每一步都包含时间、输入、输出和错误。可以深入任何阶段以检查提示、令牌使用情况和结果。
🌐 Agent traces break a run into clear steps: model calls, tool calls, and intermediate chunks. Each includes timing, inputs, outputs, and errors. Drill into any span to inspect prompts, token usage, and results.
工作流程Direct link to 工作流程
🌐 Workflows
启用可观测性后,你可以在 Studio 的 Traces 部分查看工作流的详细输出。
🌐 With observability enabled, you can view detailed outputs from your workflows in the Traces section in Studio.
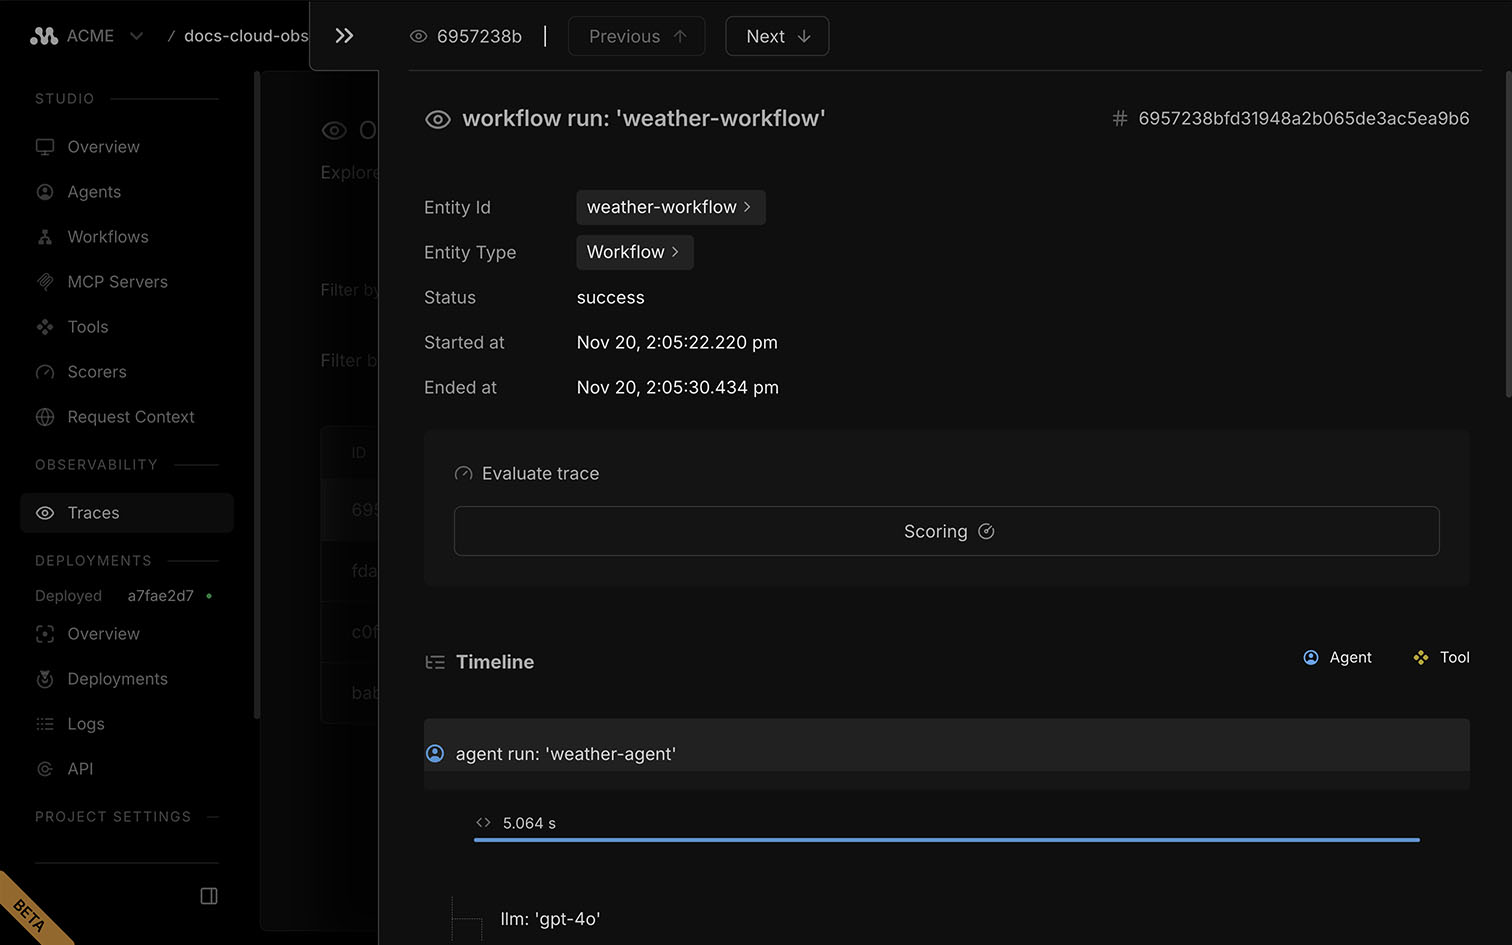
工作流跟踪记录运行中的每一步,包括转换、分支、时间以及任何工具调用。检查每一步的输入、输出和错误,以调试长期运行或多步骤的流程。
🌐 Workflow traces capture each step in the run, including transitions, branching, timing, and any tool calls. Inspect inputs, outputs, and errors for every step to debug long-running or multi-step processes.
日志Direct link to 日志
🌐 Logs
日志 页面位于 项目仪表板,用于显示调试和监控应用行为的详细信息。
🌐 The Logs page in the project dashboard displays detailed information for debugging and monitoring your application's behavior.
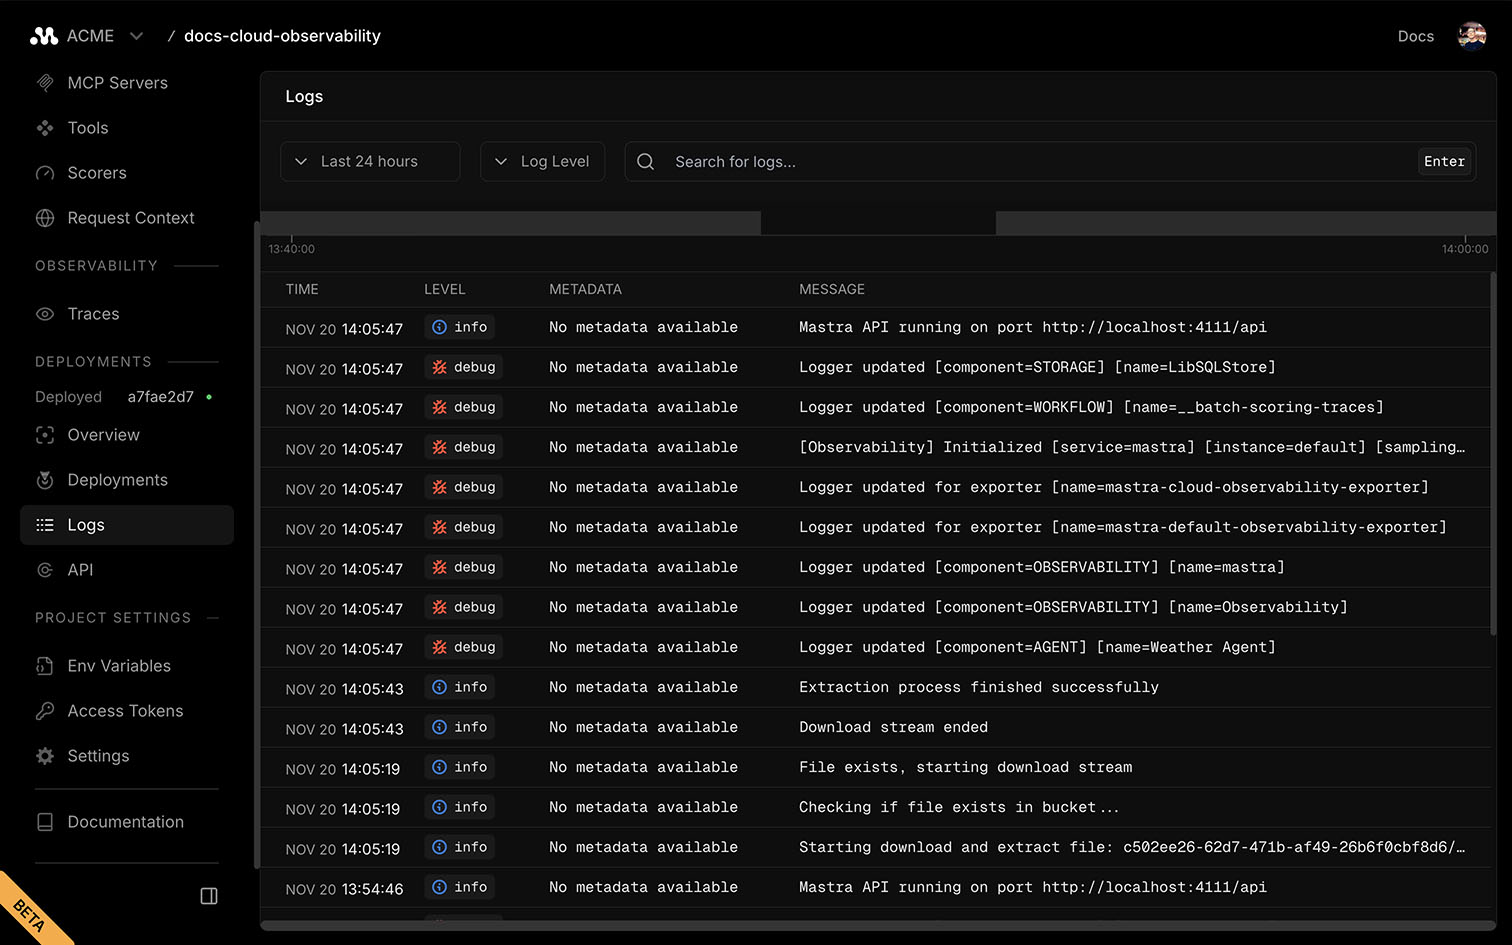
每条日志条目都包含其严重性级别以及显示代理、工作流或存储活动的详细信息。
🌐 Each log entry includes its severity level and a detailed message showing agent, workflow, or storage activity.
下一步Direct link to 下一步
🌐 Next steps